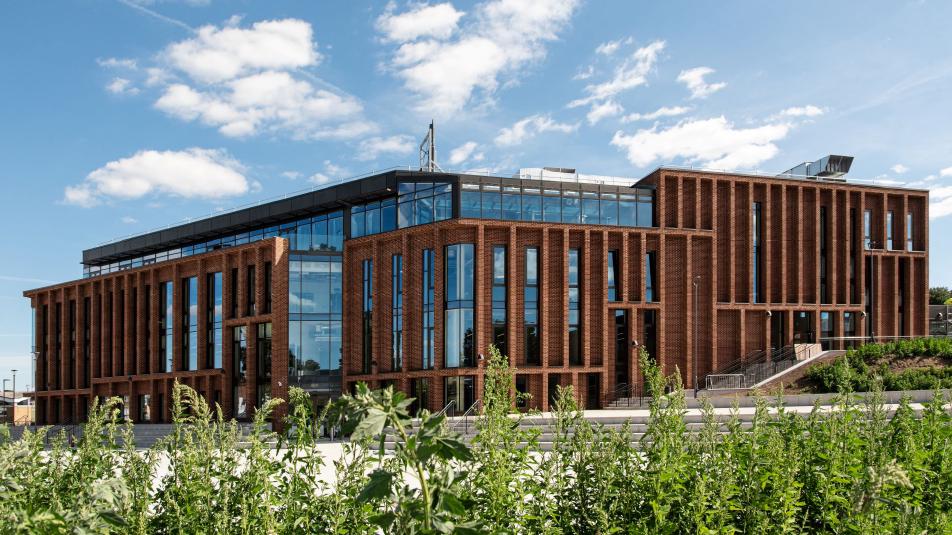
Occupancy analytics, wayfinding, and tracking for universities
Understand how your campus is really used
- Real-time occupancy data for every room and building
- Space utilisation analytics that drive estate planning
- Wayfinding, asset tracking, and people counting from the same install
The challenge universities face
Timetable data tells you what should happen. Manual audits and card-swipe systems tell you what does happen, but they're expensive, time-consuming, and unreliable. Universities need continuous, accurate data to make confident decisions about their estate.
Lecture room utilisation
Understand which teaching spaces are genuinely used and which sit half-empty. Real-time occupancy data replaces guesswork with evidence, helping timetabling teams right-size room allocations and reduce wasted capacity.
Library and study spaces
Give students live visibility of available study spaces and let estates teams see usage patterns over time. Identify peak hours, underused floors, and the real demand for quiet versus collaborative zones.
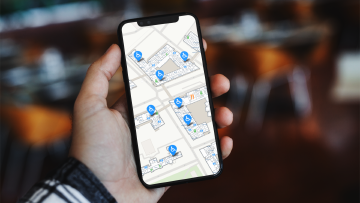
Campus wayfinding
Help new students, visitors, and open-day attendees navigate complex campuses with blue-dot indoor positioning. Reduce the anxiety and wasted time caused by confusing signage and unfamiliar buildings.
Asset tracking
Locate shared equipment like AV trolleys, medical training devices, and IT assets across buildings in real time. Reduce replacement spending and the staff time lost searching for kit that's been moved.
Why universities choose Crowd Connected
Privacy first
Occupancy counting captures aggregate numbers, not personal data. No cameras, no facial recognition, no Wi-Fi MAC addresses. When individual tracking is needed (e.g. lone-worker safety), it uses opt-in wearable tags with full consent workflows.
Covers entire buildings
Battery-powered mesh beacons self-form a network, so a single gateway covers an entire building. No power at each beacon, no cabling runs, and no dependency on campus Wi-Fi infrastructure.
Installs in hours
Beacons attach with included self-adhesive. A typical 25,000 m2 building can be covered in around four hours with no specialist tools, no ceiling access, and no disruption to teaching.
One platform, multiple use cases
Occupancy counting, space utilisation analytics, wayfinding, and asset tracking all run on the same Bluetooth mesh infrastructure and the same Crowd Connected platform.
Trusted by leading universities and colleges
How university occupancy analytics works
Small Bluetooth beacons are installed throughout campus buildings, mounted to walls or ceilings using self-adhesive. These beacons form a wireless mesh network that communicates with a single gateway per building (one power socket, one ethernet connection).
The beacons detect signals from smartphones and other Bluetooth-enabled devices carried by students and staff. The system counts the number of unique devices in each zone without identifying individuals. Crowd Connected then applies proprietary algorithms and machine learning models to convert device counts into accurate people counts, accounting for factors like device penetration rates, time of day, and building type. The result is reliable real-time occupancy data that closely reflects actual headcounts, without cameras or manual counting.
For asset tracking, equipment is fitted with small Bluetooth tags. The same beacon network pinpoints each asset’s location to within a few metres, displayed in real time on the Crowd Connected platform.
All data feeds into a single analytics dashboard where estates teams can view live occupancy, analyse trends over weeks or terms, compare actual utilisation against timetabled capacity, and export reports for space planning and HESA returns.
Planned versus actual: what the timetable misses
Most space decisions still rest on two sources that both overstate use. Booking data assumes every timetabled session runs and every seat is filled. A periodic utilisation survey captures one week and is out of date by the next term. Continuous occupancy counting shows what actually happened, hour by hour, and the gap is usually large.
In a study of 186 rooms across a multi-campus UK university, rooms were in active use for under 40% of operating hours, and were around a third full when occupied. Almost one timetabled session in six recorded no attendance at all, and the same data revealed more than 25,000 room-hours of activity with no booking behind it. None of that is visible in booking data.
By importing your timetable, the platform sets actual occupancy against what was scheduled, so you can recover wasted room-hours, flag no-shows, and right-size rooms against real demand. For the detail behind each metric, see our guide to university space utilisation, or read how the underlying occupancy analytics works.
See it in action


Frequently asked questions
How do you measure university space utilisation?
What is occupancy analytics?
How does occupancy counting work without cameras?
How is occupancy sensing different from a space utilisation survey?
Can you compare occupancy against our timetable?
Can the same system provide wayfinding and asset tracking?
How long does it take to deploy across a university campus?
Get updates and insights from Crowd Connected
Thank You
Thank you for submitting your details. You're signed up to our newsletter!
Sorry
There was a problem submitting this form. Please check your entries, ensure you're online, and try again.