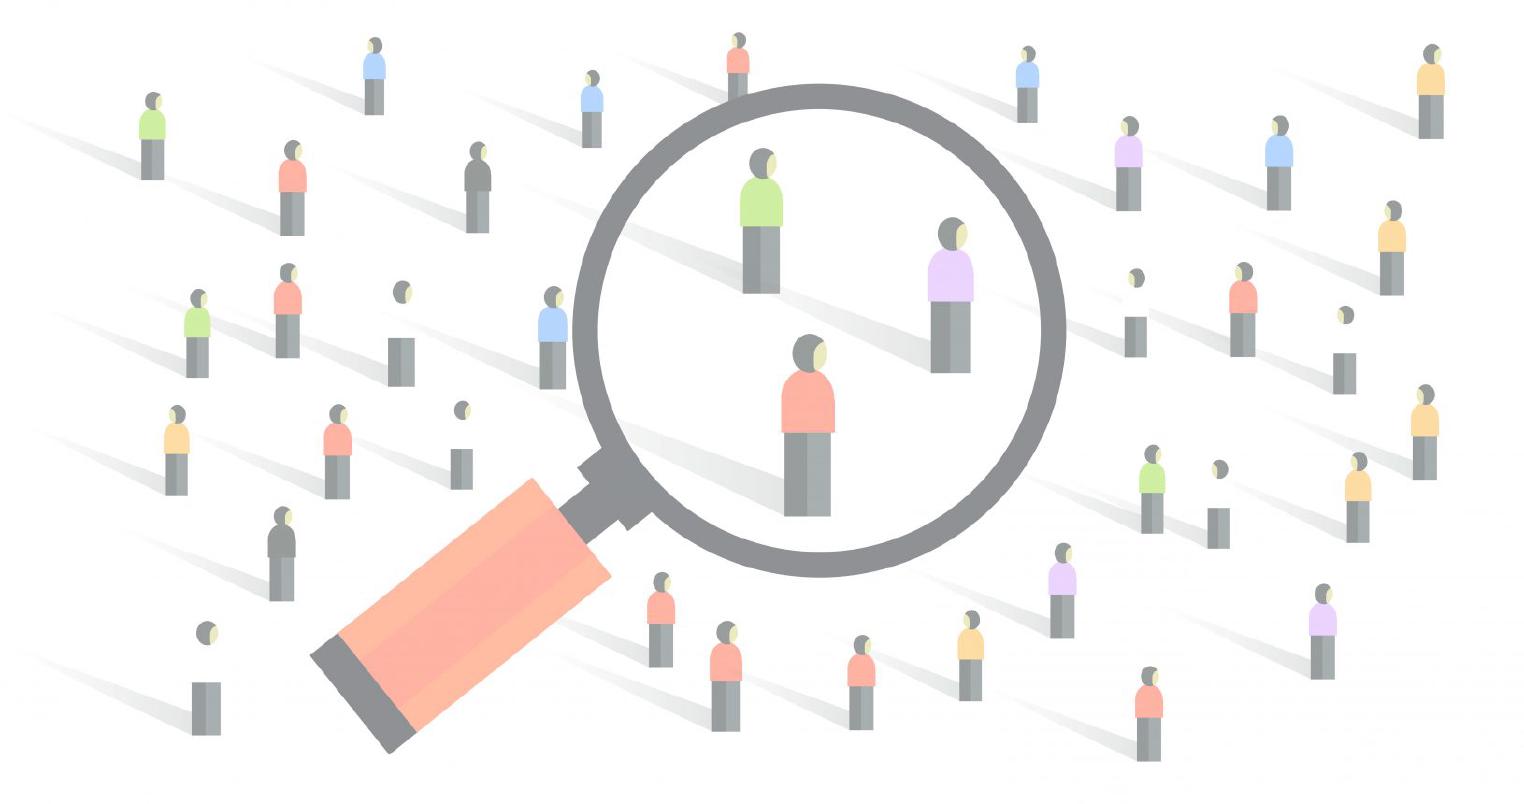
People counting is the process of measuring how many people enter, exit, or occupy a physical space. It’s used in retail, universities, hospitals, event venues, transport hubs, and offices to understand footfall, optimise operations, and plan capacity. Occupancy analytics takes this further - combining headcounts with dwell time, flow patterns, and trend analysis to answer not just “how many?” but “how are people using this space?”
The technology landscape has evolved significantly since the first beam counters appeared in retail doorways. Today there are at least seven distinct approaches, each with different trade-offs between accuracy, cost, privacy, and coverage. This guide compares them all for 2026.
Every people counting method compared
| Method | Accuracy | Coverage | Cabling needed | Privacy | Cost |
|---|---|---|---|---|---|
| Infrared beam | 90-95% | Doorways only | Power per sensor | High | £200-500/door |
| Thermal sensors | 90-95% | ~10 m² per sensor | PoE + IP per sensor | High | £100-200/sensor |
| Stereo cameras | 95-99% | Doorways only | Power + network | Low | £1,000-3,000/unit |
| Wi-Fi tracking | 60-75% | Building-wide | None (existing APs) | Medium | Low |
| Bluetooth mesh | 85-95% | Whole building | None (battery beacons) | High | £5-15/beacon |
| LiDAR | 95-98% | 5-10 m radius | Power + network | High | £2,000-5,000/unit |
| App-based | 95%+ (of app users) | Entire venue | None (software only) | High | Software only |
1. Infrared beam counters
Infrared beam counters are the simplest and most widely deployed footfall technology. A transmitter and receiver are mounted on either side of a doorway; when someone walks through, the beam breaks and a count registers.
Strengths: Low cost, easy to install, reliable for single-entrance counting, no privacy concerns.
Limitations: Only counts at doorways - you know how many people entered, but not where they went or how long they stayed. Can’t distinguish direction without paired sensors, and struggles with groups walking side by side. Provides footfall data, not occupancy or behaviour data.
Best for: Retail stores and visitor attractions that need simple daily entrance counts.
2. Thermal sensors
Thermal sensors (like those from Butlr or Irisys) detect body heat to count people in a defined area. They typically mount overhead and cover around 10 square metres per sensor.
Strengths: Genuinely privacy-first - no images captured. Can detect presence and headcount in real time. Battery-powered options available for some models.
Limitations: Coverage per sensor is small, so you need many sensors for large spaces - roughly one per 10 m². Low ceilings reduce coverage further, so a room that might need just four Bluetooth beacons could require more than 20 thermal sensors. Each sensor usually requires network and power (typically PoE), which means significant cabling at scale. Most thermal sensors provide occupancy counts only, with no positioning, wayfinding, or flow analytics.
Best for: Office meeting rooms and phone booths where per-room headcount is the primary need and the space is small enough for a single sensor.
3. Stereo cameras
Stereo cameras use dual lenses to create a depth map, counting people as 3D shapes rather than flat images. They’re the most accurate doorway-counting technology available.
Strengths: Very high accuracy (95-99%), can count in both directions simultaneously, works in varying light conditions.
Limitations: Cameras capture images, which raises GDPR and privacy concerns even when footage isn’t stored. Coverage is limited to the camera’s field of view - typically a single doorway or small area. Expensive per unit and requires power and network cabling. Provides counting, not tracking or analytics.
Best for: High-footfall retail entrances and transport hubs where entrance accuracy is critical and privacy concerns can be managed.
4. Wi-Fi tracking
Wi-Fi tracking uses existing wireless access points to detect probe requests from smartphones. When a phone searches for available networks, the access points log its presence.
Strengths: Uses existing infrastructure, so no additional hardware cost. Can provide building-wide coverage.
Limitations: Accuracy has degraded significantly since Apple and Google introduced MAC address randomisation. Capture rates are now typically 6-12% of actual visitors, making reliable headcounts difficult without heavy statistical modelling. Frequency of detection is variable - phones that aren’t connected may only “ping” every five minutes. The consensus is that MAC addresses, even when hashed, fall under GDPR, requiring explicit consent that’s impractical to obtain in most settings. Wi-Fi tracking is increasingly considered a legacy approach.
Best for: Rough zone-level traffic estimates where existing Wi-Fi infrastructure is already in place and precision isn’t critical.
5. Bluetooth mesh (device detection with machine learning)
Bluetooth mesh is a newer approach where battery-powered BLE beacons installed throughout a building detect Bluetooth signals from smartphones and devices. Machine learning algorithms then convert device counts into accurate people estimates.
Strengths: Covers entire buildings from a single gateway - no per-room sensors needed. Battery-powered beacons install in hours with no cabling. Privacy-first: no images, no MAC addresses, no personal data. The same infrastructure can support wayfinding, asset tracking, and location analytics. Self-calibrating algorithms adapt to different environments without manual tuning.
Limitations: Accuracy depends on device penetration rates (what percentage of occupants carry Bluetooth-enabled devices). In university and office environments this is typically 85-95%, but in settings where visitors are less likely to carry phones, accuracy drops.
Best for: Universities, hospitals, event venues, and smart buildings where whole-building coverage, privacy, and multiple use cases matter more than doorway-level precision. Crowd Connected uses this approach.
6. LiDAR
LiDAR (Light Detection and Ranging) sensors use laser pulses to create a 3D point cloud of a space, detecting and counting people as moving shapes.
Strengths: Very high accuracy, works in all lighting conditions, genuinely anonymous (no images). Can detect direction and speed of movement.
Limitations: Expensive per unit (£2,000-5,000+), limited coverage radius (typically 5-10 metres), requires power and network connectivity. Not practical for large-scale deployments across entire buildings.
Best for: High-security entrances and specific chokepoints where precision and anonymity are both critical.
7. App-based analytics
Where visitors already use a mobile app (common in events, retail, and some campus environments), the app itself can provide location data. An SDK embedded in the app uses Bluetooth beacons and phone sensors to determine the visitor’s position continuously.
Strengths: The most detailed data available - individual journeys, dwell time, flow patterns, conversion between zones. Works on both iOS and Android. Privacy is handled through app permissions and opt-in consent. Data can be gathered in background mode when the phone is in the visitor’s pocket.
Limitations: Only works for visitors who have the app installed and have opted in. Penetration rates vary widely by context - at conferences with a dedicated event app, 60-80% is typical; in retail, it may be much lower.
Best for: Events, exhibitions, and venues with high app adoption where individual-level journey analytics are valuable. Crowd Connected’s location analytics, people tracking, and attendee tracking solutions use this approach.
People counting and occupancy analytics for universities
Universities face a specific challenge: they need to prove how their estate is actually used, not just how it’s timetabled. HESA’s Estates Management Statistics require institutions to report space utilisation data, and funding bodies increasingly tie capital investment to evidence of demand. Yet most universities still rely on manual audits - staff walking through buildings with clipboards during a sample week - which captures a fraction of the picture and costs thousands in staff time each year.
Automated occupancy analytics changes this. Instead of a snapshot, universities get continuous data across every teaching room, library zone, social space, and laboratory. The data answers questions that timetable records can’t: Which rooms are booked but consistently empty? Where do students actually study outside of lectures? Are new buildings justified by demand, or would refurbishment of under-used spaces achieve the same result?
Bluetooth mesh is particularly well-suited to university campuses. A single gateway can cover an entire building, battery-powered beacons install in hours without disrupting teaching, and there are no cameras or personal data involved - which matters when students are increasingly vocal about surveillance on campus. The same beacon infrastructure can also power wayfinding for open days and freshers’ week, asset tracking for IT equipment, and real-time room availability displays.
Canterbury Christ Church University deployed Crowd Connected’s occupancy analytics across its campus to move from timetable-based assumptions to real utilisation data - giving estates and timetabling teams the evidence they needed to make better decisions about space allocation and capital planning.
Choosing the right approach
There’s no single best people counting technology. The right choice depends on what you’re trying to measure, how much of your estate you need to cover, and how you’ll use the data.
If you need entrance accuracy at a single doorway, stereo cameras or infrared beams are proven solutions. If you need whole-building occupancy across a campus, hospital, or venue - especially where privacy matters - Bluetooth mesh with machine learning offers the broadest coverage at the lowest deployment cost. If your visitors already use a mobile app, app-based analytics provides the richest behavioural data available.
The most important question isn’t “which sensor is most accurate?” but “what decisions will this data support?” A 98%-accurate doorway counter that only covers one entrance tells you less about your estate than an 85%-accurate system that covers every room in every building, continuously.
Whatever approach you choose, look for a solution that’s composable - one that can start with occupancy counting and grow into wayfinding, asset tracking, or flow analytics without ripping out hardware and starting again.
Ready to measure how your spaces are really used? Talk to our team about occupancy analytics for your buildings.