2017 Festival Insights Infographic
(Some of) what we learnt last year
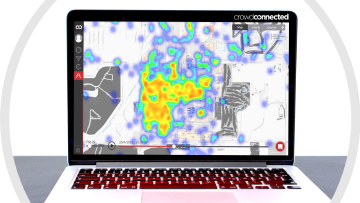
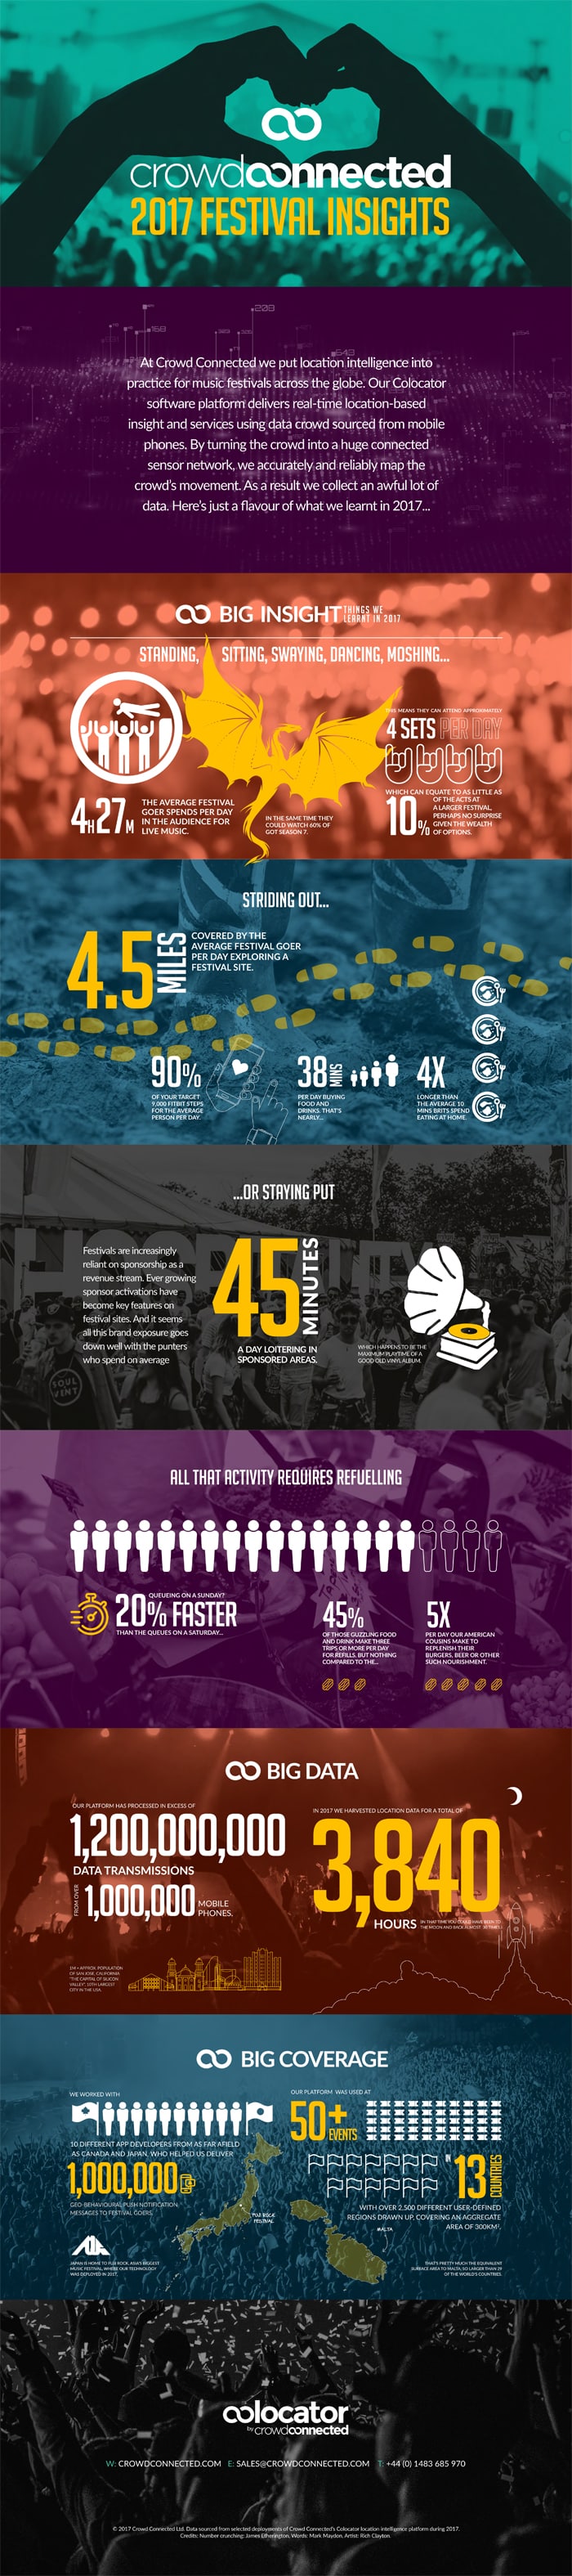
In 2017 our Colocator location intelligence software was deployed at over 50 festivals around the world, delivering location-based insight and services using data crowdsourced from mobile phones. By turning the crowd into a huge connected sensor network, we accurately and reliably map the crowd’s movement – crucially, in real time. As a result, we collect an awful lot of data (in excess of 1.2 billion data points, to put a figure on it). And in between tucking into the Christmas turkey and unwrapping the odd present, we’ve trawled this vast data pool and uncovered a few nuggets, such as:
- How many miles the average festivalgoer covers a day
- How much time is spent listening to music versus visiting sponsor activations
- How many visits to food and drink outlets
It’s all captured in the infographic below which you can also download as a here
Infographic Festival Insights 2017
Share This Infographic On Your Site:
https://www.crowdconnected.com/downloads/CC-FESTIVAL-INSIGHTS-2017.pdf

